 Collaborator: Balamurali K. Ambati, MD, PhD
Associate Professor, Ophthalmology & Visual Sciences
Project
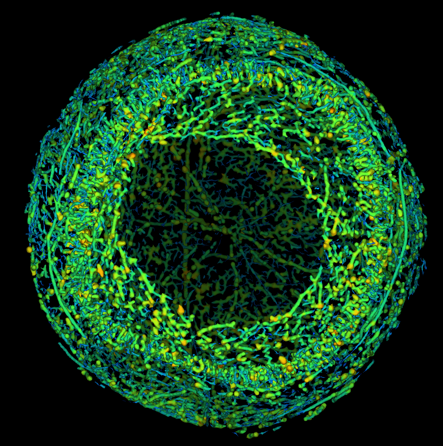
Animal Models: Diabetic mice develop retinal vascular dropout over 6 months of hyperglycemia. Macular degeneration models can be induced in mice with laser inciting choroidal neovascularization. Biologically and clinically relevant endpoints include vascular density, flow, neovascular lesional volume, and leakage.
Computed Tomography: All samples were scanned on a high-resolution, volumetric microCT scanner (μCT40, ScanCo Medical, Zurich, CH). The image data was acquired with the following parameters: 10 μm isotropic voxel resolution at 300 ms exposure time, 2000 views, and 2 frames per view. In vivo, optical coherence tomography is obtained with Heidelberg Spectralis. Ex vivo, retinal vascular architecture and CNV lesional volume are quantified by immunofluorescence staining on confocal microscopy. Data Processing and Image Generation: The microCT-generated DICOM files were converted to a format used to analyze the samples and to create volume renderings of the regions of interest. The raw data files can be viewed using Numira’s software, AltaViewerTM. SCIRun (Scientific Computing and Imaging Institute, University of Utah) was used to generate 3D images of each sample. Segmentation: The microCT-generated DICOM files were converted into a file format compatible with the segmentation software, Numira’s VHLab. VHLab was used to create a label map associated with the vessels from the imaging data for each specimen. SCIRun (SCI Institute) was used to generate the frames for the rotating 3D movies. The movie frames were then converted into QuickTime (Apple, Inc) movies for viewing.
BIDAC Contact: Greg Jones
BIDAC Expertise
Optimization of the segmentation and quantification of the images in an automatable fashion: BIDAC can extend Seg3D to natively import OCT datasets, and develop a mostly-automated algorithm for tracking the boundaries of the CNV. Datasets can then be aligned in Seg3D, and then the combined analytics can be loaded into their SCIRun software for fused visualization.